
Zignyl gives you access to reports that will help you understand your locations finances and operations to aid in making smart business decisions.
Types of Reports
There are seven types of reports that you can run in Zignyl:
-
Zignyl Report
-
Location Performance Report
-
Employee Sales Report
-
Time Clock Report
-
Task Completion Report
-
Tips Report
-
CSV Reports
To access the reports, start by visiting your Zignyl Management Portal and choose Reporting from the menu. Note: Access to specific reports depends on your permission level. To view which User Roles have access to these reports, please see our User Roles & Permissions guide.

You will then see the Reporting menu, here you can choose which report you would like to run.

Zignyl Report
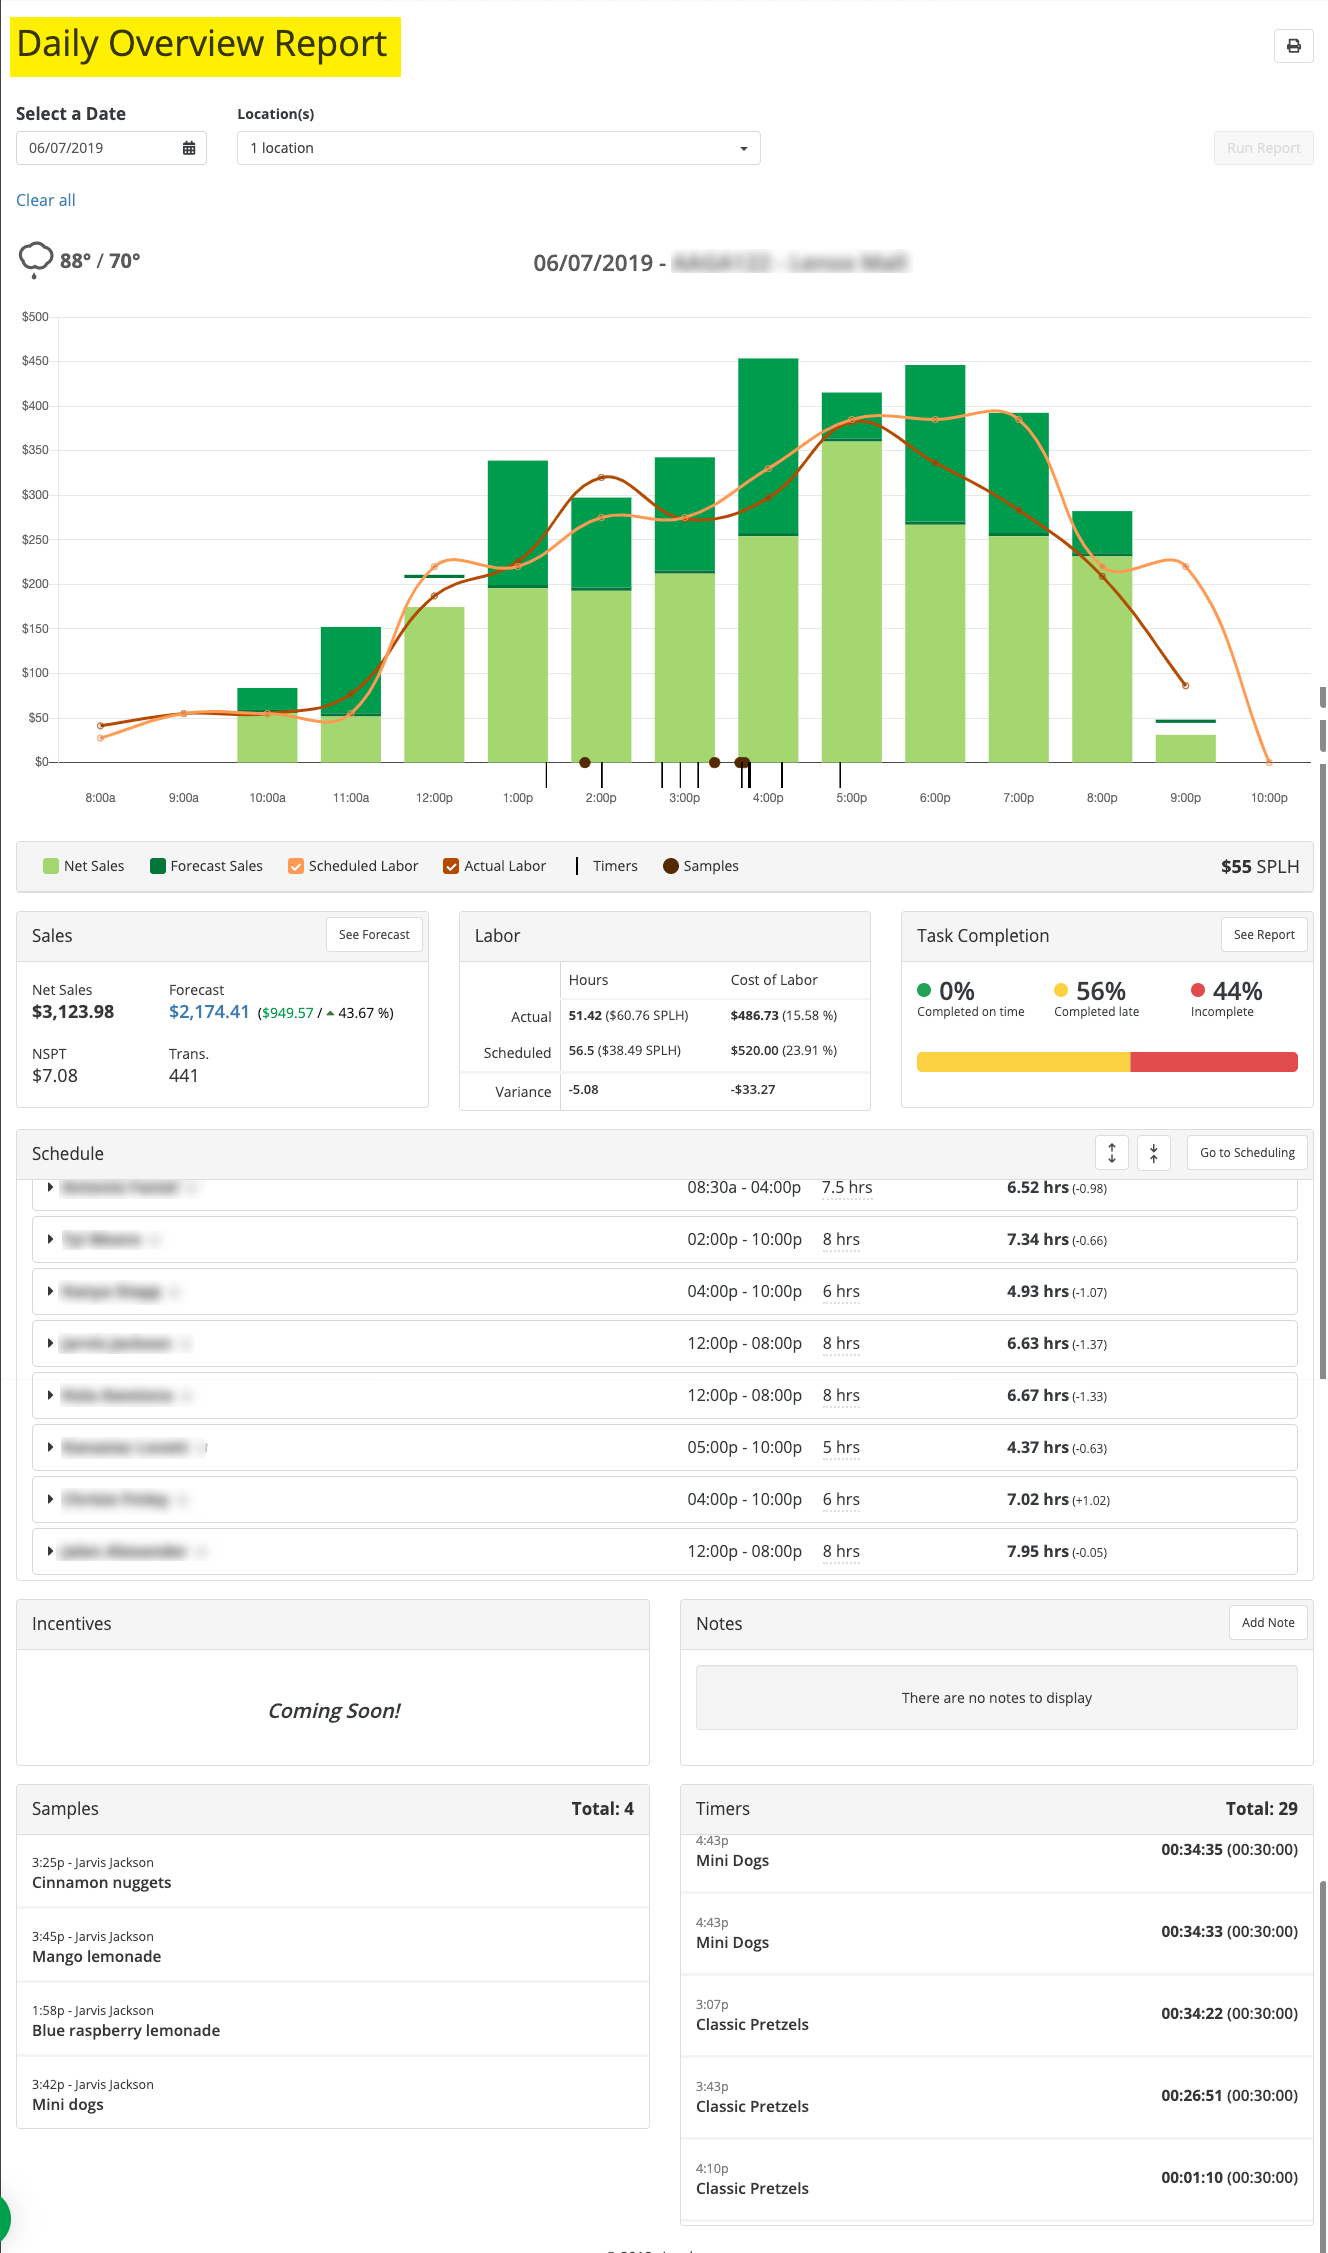
The Zignyl Report provides both a financial and operational summary of what happened at any one of your locations. You can use this report to quickly review your store's performance and find areas that need to be addressed. You can access it directly here.
-
To run the report, click on Run a Daily Overview Report. Select a date and location, click on Run Report. Here you will see how the store's operations are in regards to Sales, Labor and Task Completion.
-
-
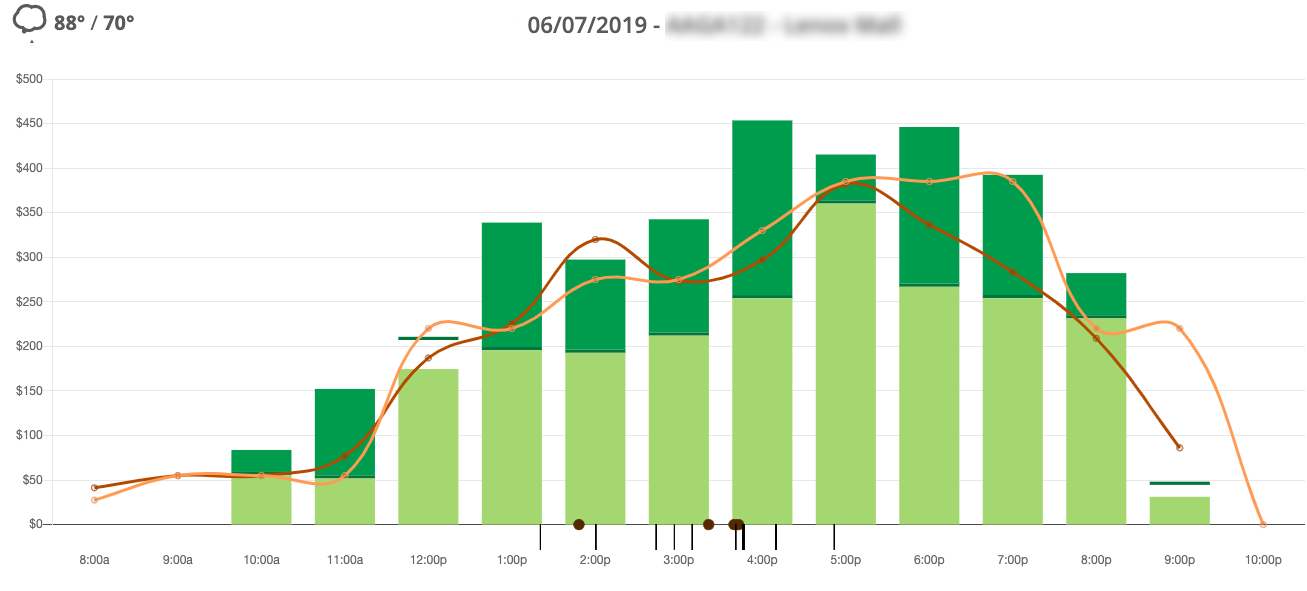
In the graph above, you can see how actual sales stand up to forecasted sales by the hour. Your net sales in light green are the actual sales that were completed in your POS system. At this time Zignyl pulls sales data from Revel every 15 minutes. If your location uses Treatdata or Micros POS, we are only able to pull in sales data at the end of the day (2 AM). The dark green line is the forecasted sales, any sales above forecasted will show dark green. Ideally, your net sales will always be higher than your forecasted sales. If they are not, look to the dark brown spots-it lets you know when sampling is taking place.
-
Under Sales you will see that Net Sales vs Forecast is listed and shows the difference in $. This also shows the Daily NSPT (Net Sales Per Transaction) and the Transaction count for this location.
-
Labor hours are divided out to show the SPLH (Sales Per Labor Hour) for that day. The light orange line will show what the scheduled labor goal is and the dark orange line will show the actual labor used. You can click on a line and it will show the actual labor vs scheduled labor for any hour.
-
-
If your net sales are above the dark orange line, it is an indicator that scheduling additional staff would theoretically have led to an increase in sales.
-
Hint: An Area Director or Company Admin can adjust the Sales Per Labor Hour in the Location Settings.
-
Under Task Completion you will see the percentages of tasks completed on time, late or incomplete. If you notice concerning data, for example, that 35% of tasks were not completed, you can click on the Task Completion Report button to get more information. You will learn more about the Task Completion Report further down in this article.
-
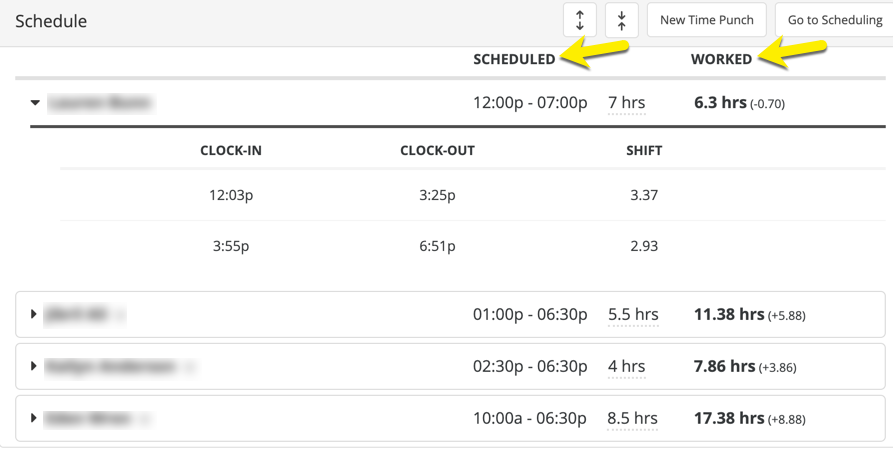
You can also see the employee time sheet for the day. Under Schedule this shows the time cards for every employee who worked at the location on that day. This list helps to easily identify incorrect time punches. For example: if an employee was on the clock for 9 hours, it is easy to see if they clocked in/out for break. You can also fix time clock errors from here as well by clicking on the pencil icon next to the incorrect time or you can even add a New Time Punch by clicking on the button.
-


Location Performance Report
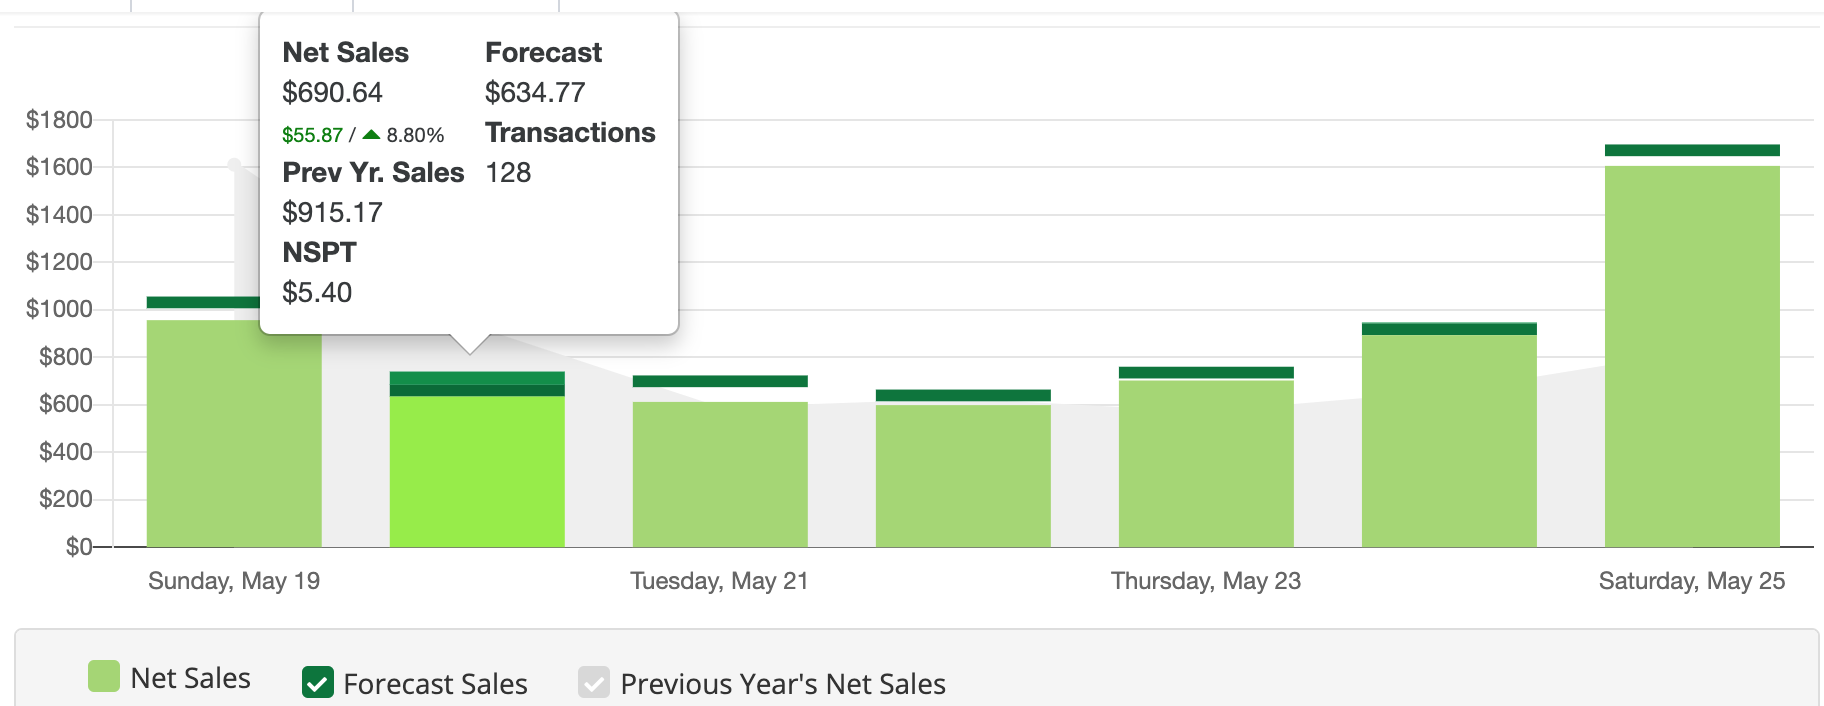
The Location Performance Report provides information on the Net Sales of a company on a whole and down to individual store locations. The graph is interactive and you can scroll over the points above each day to see the daily net sales. This report is most accurate and helpful when you are continuously creating accurate forecasts. You can access it directly here.
-

-
The graph is interactive and you can scroll over the points above each day to see the daily net sales. You can compare this with a selected date range as well to see how a location or group of locations performed compared to another range of time. This report is most accurate and helpful when you are continuously creating accurate forecasts.
-

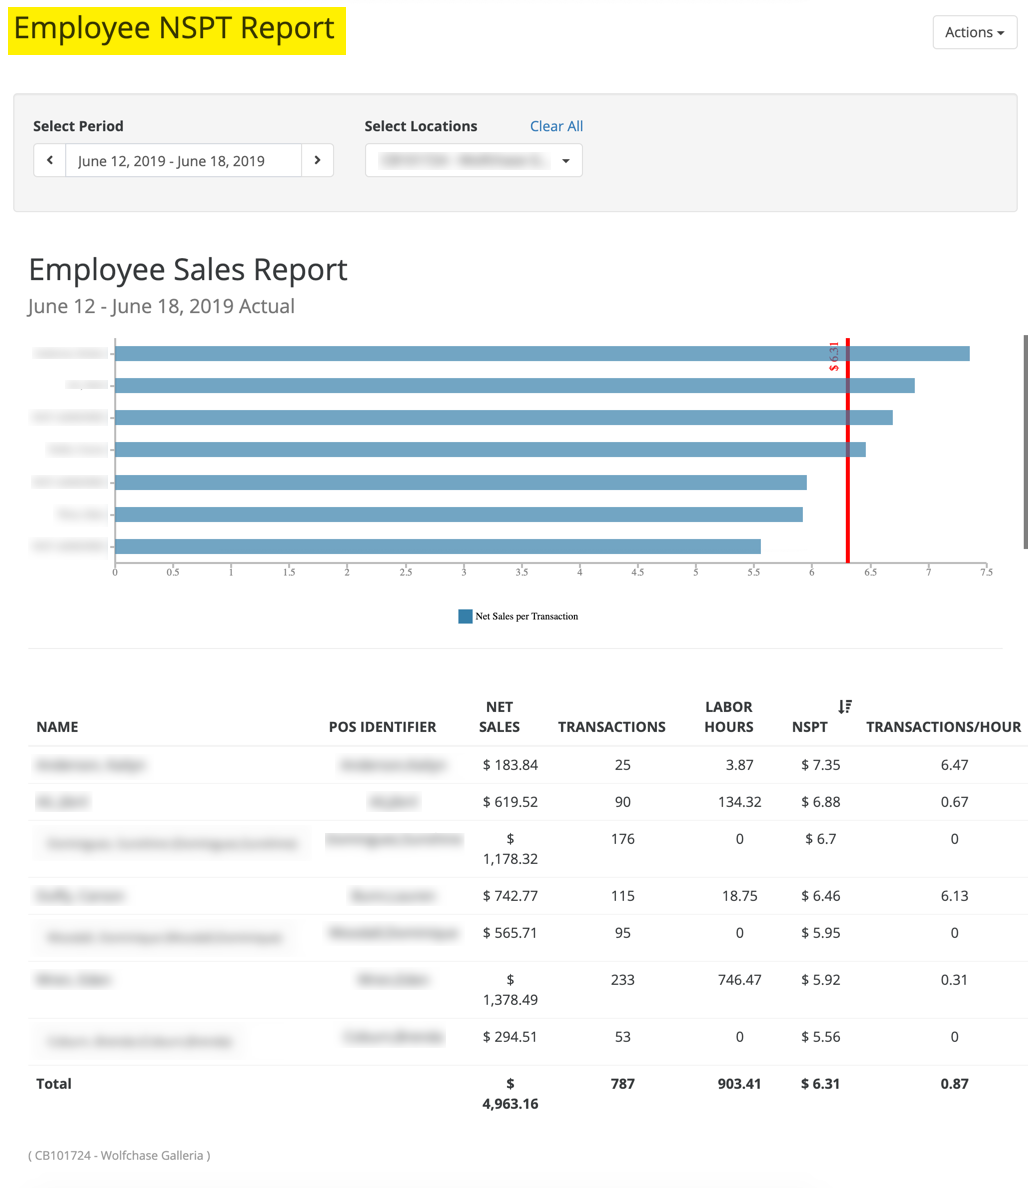
Employee Sales Report
The Employee Sales Report provides data about employee sales and Net Sales Per Transaction. zignyl imports transaction data from your POS system and calculates the transactions per hour per employee.
-
To run this report, choose the date, location(s) you want included in the report.
-
-
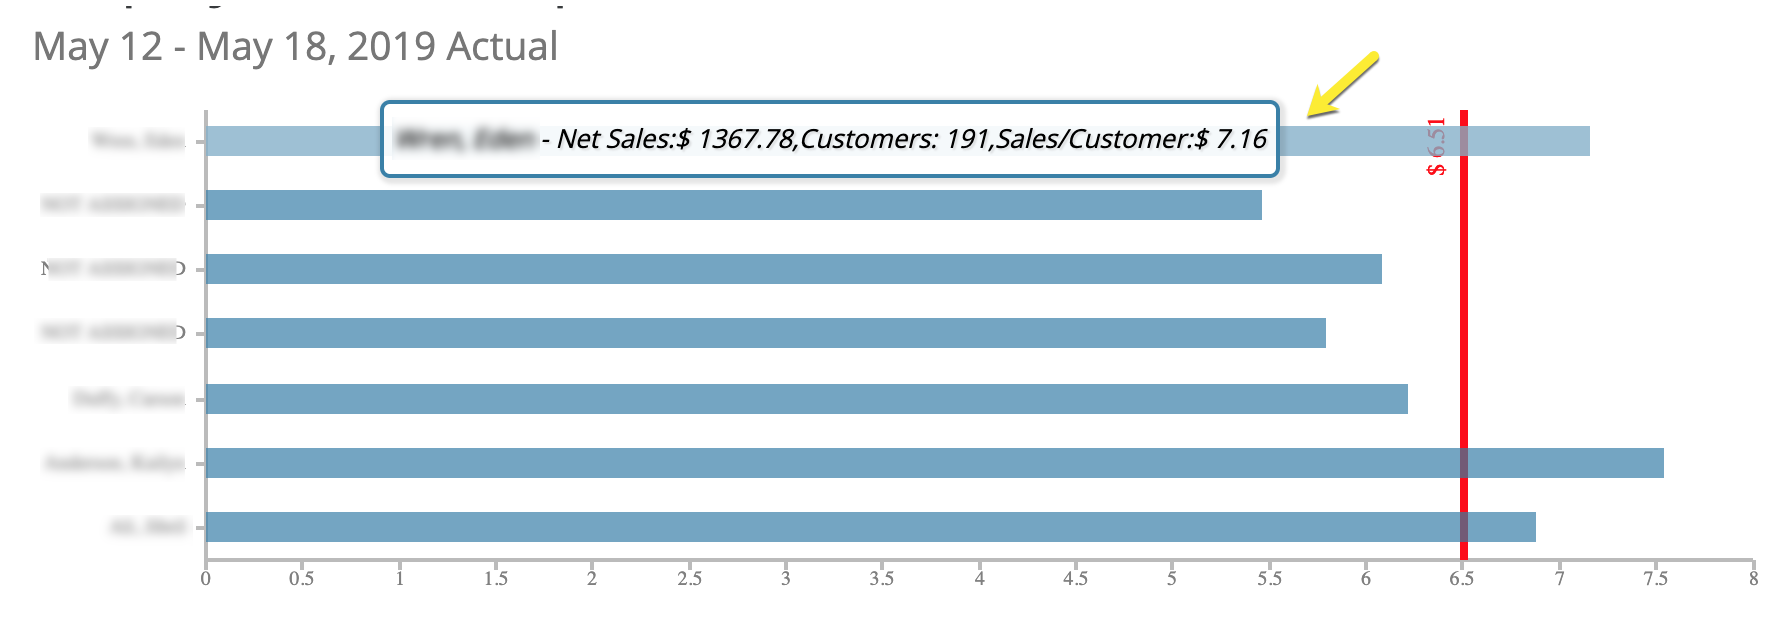
The graph is interactive and you can scroll over an employee’s bar to see their Name, NSPT, Net Sales, and Customer Count. The red vertical line marks the average NSPT for the selected time period.
-
-
To see which employees are performing best at the register, start by sorting the table by the NSPT column.
-

-
Understanding the Red Line: The vertical red line represents your store's Average NSPT for the selected period. This is your quick "performance barometer":
-
Right of the Line: These employees are selling above the store average (Top Performers).
-
Left of the Line: These employees are selling below the store average and may need additional coaching on upselling or product knowledge.
-
-
Then, see if the employees with the highest NSPT also have the highest number of transactions. If the transaction count seems extremely low, it's likely that there is not enough data to give you an accurate NSPT. An example would be an employee could ring up one $100 catering transaction, giving them an NSPT of $100. While a co-worker who rings up 150 regular orders throughout their shift has an NSPT of $6.50.


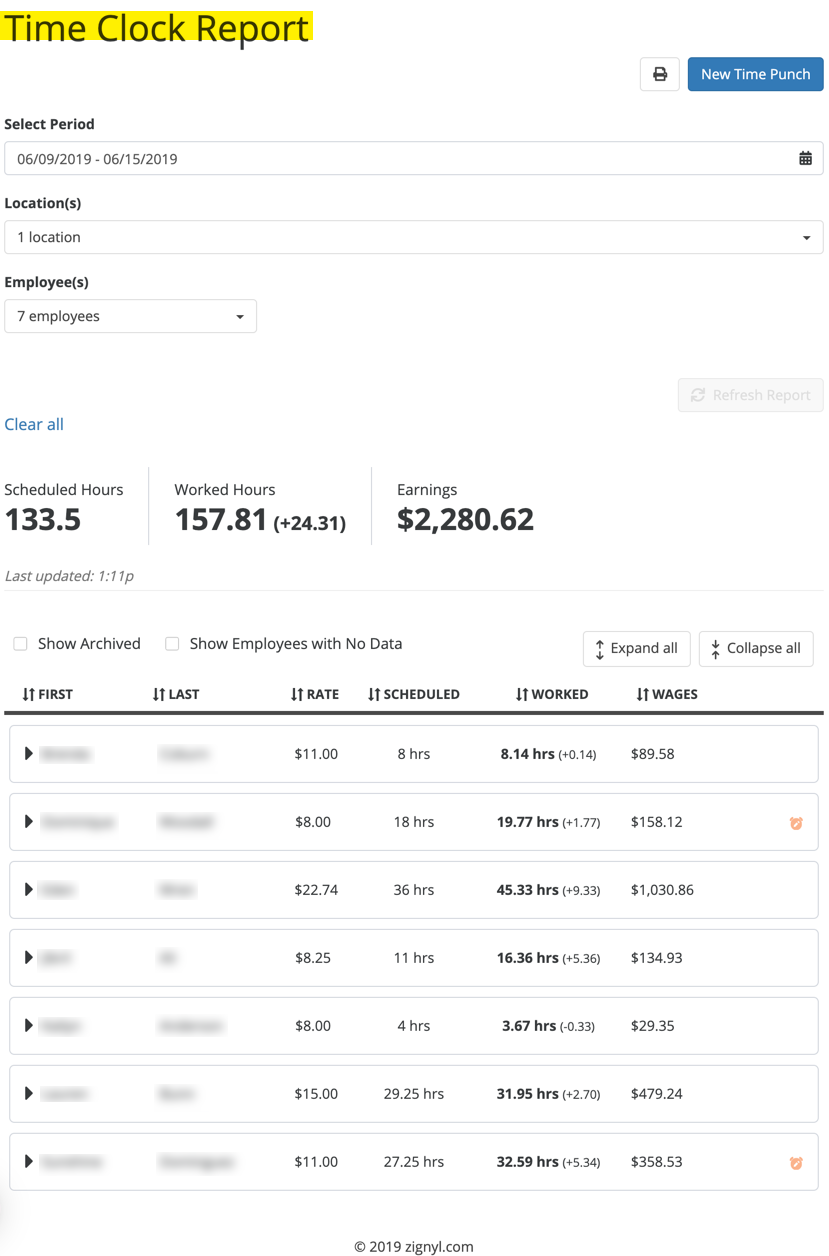
Time Clock Report
This report compiles all clock in and clock out data for all employees at your location(s). You are able to customize this report by date range and location.
-
To run the report, select a date range and location. You’ll be able to see each employee’s clock-ins/clock-outs, hourly rate, hours scheduled, total number of hours worked, and the amount they should be paid.
-
The report gathers timesheet data from the Zignyl time clock on the Location Dashboard. Rate information for each employee comes from the employee’s zignyl profile.
-
-
You can compare the hours scheduled vs the hours worked. This report can also help to confirm that employees are taking breaks, look for two clock-ins/outs on the same day. If you see longer hours (six or more) without a clock-in/out, the employee either did not take a break or forgot to clock-in/out correctly. This final report can be printed and sent to your payroll company for employee payment.
-
Also you can make any corrections needed straight from the report by clicking on the + icon or add a new time punch by clicking on the blue New Time Punch button.
-
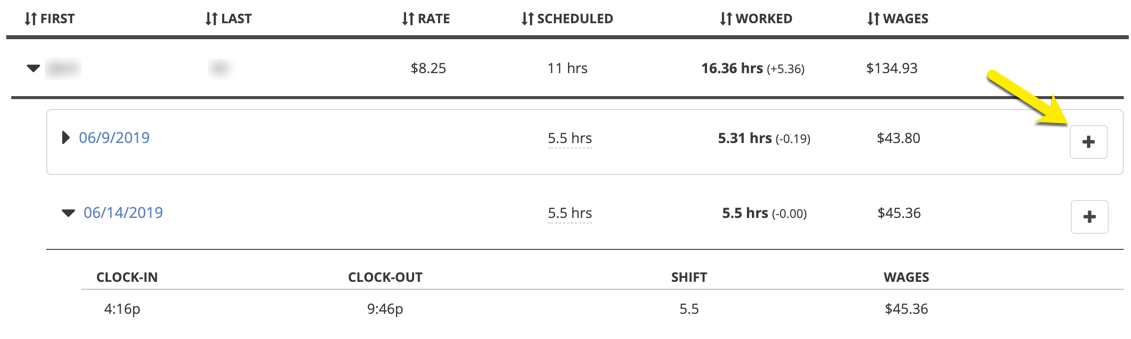
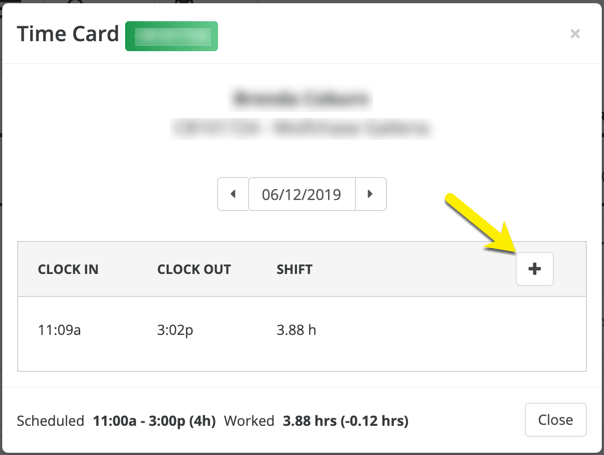


To Correct Time Punches
-
Click on the arrow next to the day that needs to be changed, then hover on the time punch, a pencil icon will appear. Click on the date that needs to be change. You are now able to change the clock in/out times for the chosen day.
-

-
The Time Card box will appear. Click on the time needing changed, then click on the pencil icon when it appears.
-


-
Once you have entered the correct time punch, you will need to add a note to describe what the issue was as to why the employee was unable to clock in/out that day. Click save changes and you will see that the new time punch has been added.
-


Enter a New Time Punch
-
When a team member has not clocked in/out properly on a day, the manager will have to manually enter the time for them. First go to the employee's profile from the Human resources tab.
-
Click on New Time Punch.
-

-
If an employee is assigned to more than one location, you will then need to choose the correct location. Then enter the date and the correct clock in/out times.
-


-
Once you have entered the correct time punch, you will need to add a note to describe what the issue was as to why the employee was unable to clock in/out that day. Be sure that you enter both the clock in/out or the new time punch will not be saved. Click save changes and you will see that the new time punch has been added.
-
Hint: Make sure that the date is correct before saving.
-


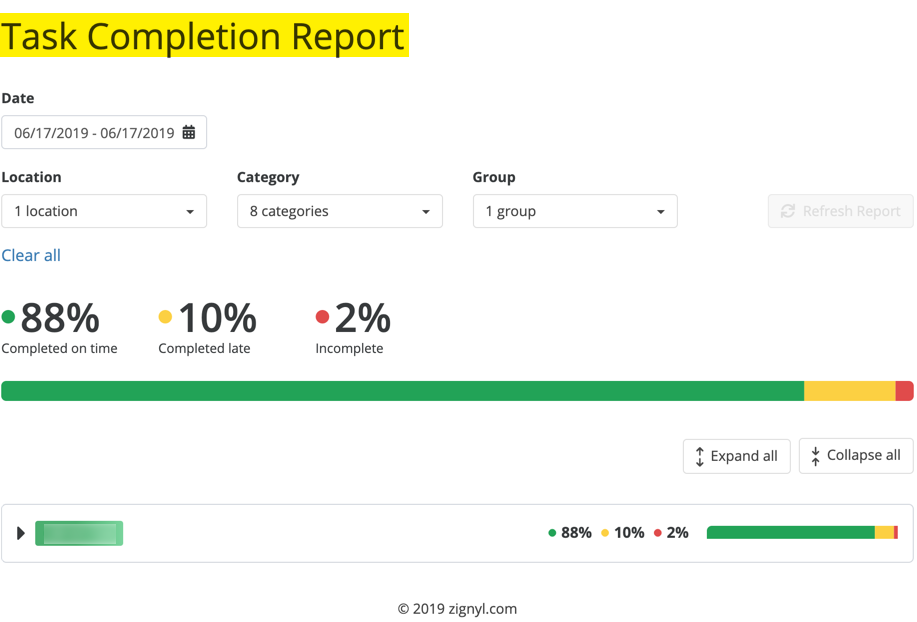
Task Completion Report
The Task Completion Report provides information on how many tasks at a location have been completed over a selected time period. The table displays Task Title, Category, the time the task is due, the time the task was completed, and an employee initial and notes if applicable to the task.
-
To run the report, go to Reports and choose Task Completion Report. Then, select a date range and locations to include in the report. You can filter the report by category, which is useful when checking to see if Health Department tasks have been done.
-
When employees complete tasks on the location dashboard in your store, they’ll show up in the Task Completion Report.
-
-
To read the report, start by looking at the overall task completion rates - green represents tasks that are completed within the allocated time, yellow represents tasks that were completed after the allocated time passed, and red represents tasks that weren’t completed.
-
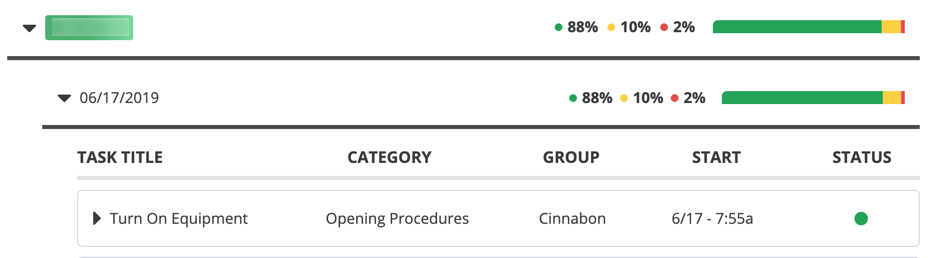
By clicking on the company, you will see a drop down that gives titles of each individual task. Here you can scroll down and see the status of each task. When they started and whether or not they were completed on time or late or incomplete.
-


Tips Reports
The Tips Report provides a granular breakdown from your POS of how credit card, cash, and custom tips are distributed among your staff and location(s). It is an essential tool for verifying payroll and auditing tip pooling calculations.
-
To access it, navigate to Reports > Tips Report:

-
Generating the Report: Use the filters at the top of the page to define your data set:
-
Select Period: Use the calendar dropdown to choose a specific date range (e.g., Last Week or a custom range).
-
Location(s): Select the specific store(s) you wish to audit.
-
Employee(s): You can run this for the entire roster ("All employees") or select a single individual to audit a specific paycheck.
-
Run Report: Click the blue button to generate the data.
-
-
Summary Cards: The top of the report displays the high-level totals for the selected period: Total Tips, Credit Card Tips, Cash Tips, and Custom Tips. Use this to verify against your POS daily summary.

-
Detailed Breakdown & Tip Pooling Below the summary, the report lists every employee and their total tip payout.
-
Drill Down: Click the arrow next to an employee’s name (or use the Expand all button) to see a breakdown by Location and then by Date.
-
Pooling Audit: Expanding a specific date reveals the exact math used to calculate their share, including:
-
Total Tip Pool Hours: The total hours worked by the entire team that shift.
-
Hours Worked: The specific hours worked by this employee.
-
Percentage of Hours Worked: The employee's slice of the pool (e.g., 44.82%).
-
Tip Share: The final dollar amount allocated to them.
-
-
The below screenshot gives you a preview of what to expect as you pick your location(s), timeframe, employee(s) for which you want to view:
-

CSV Reports
For CSV Reports, please click the dropdown or navigate here, which will allow you to do the following things:
-
Select the Report type you want to export to CSV:

-
Select the Period/time range as shown below:

-
Select the Location(s) you would like to run the report for as shown below

-
Click "Export as CSV" in the blue button towards the right of the screen:

-
Please note that this will generate a .csv download in your browser. We advise that this be done on a desktop or laptop browser, as this is not recommended on a mobile device due to formatting and download/access reasons. You'll see this window below as you click the export button:
